Linux Performance Tools
Brendan Gregg's tour of the Linux observability toolbox — what each tool measures, when to reach for it, and a methodology for going from 'it's slow' to a real answer.
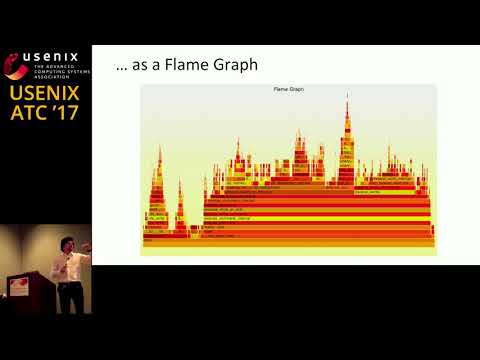
Visualizing Performance with Flame Graphs
How a simple visualization of sampled stack traces became the default lens for CPU profiling — and how Gregg uses it to find real wins in real systems.

HTTP/2 is Here, Let's Optimize!
Ilya Grigorik explains what HTTP/2 actually changes on the wire — multiplexing, prioritisation, server push — and which old optimisations you should stop doing.

How Complex Systems Fail
Richard Cook unpacks his classic essay live: there is no root cause, safety is something people continuously create, and catastrophe is the alignment of many small latent failures.

Debugging Under Fire: Keep your Head when Systems have Lost their Mind
Cantrill on the discipline of debugging production systems in real time — staying analytical when the pager is screaming and the business is bleeding.

Owning Your Performance: RAIL
Paul Irish demonstrates the RAIL model and walks through diagnosing real performance problems live in Chrome DevTools.
Data-Oriented Design and C++
Mike Acton on how modern CPUs really work, and why most of what 'clean code' calls good is actively at war with performance.